Measurement of 3D velocity and transport of nanoparticle in rock core by High - Resolution Magnetic Resonance Imaging
- 1. University of Glasgow, School of Geographical and Earth Sciences, Glasgow, United Kingdom
- 2. University of Glasgow, Institute of Neuroscience and Psychology, Glasgow, United Kingdom
Introduction:- Nanoparticles have a wide range of applications such as cosmetics, textiles, paints and drug delivery. Once nanoparticles are released in to ground waters they might have toxic effects. To protect groundwater from this new threat we must be able to predict nanoparticle movement within the aquifer. Critically, however, we are at present unable to do this due to significant limitations in current experimental datasets which lack spatial resolution. To overcome this fundamental knowledge gap, we have used MRI to collect spatially resolved data on NP concentration [1] and three dimensional (3D) velocity in a sandstone core [2] . From such data we will seek to develop more robust NP transport models.
Methods:- An epoxy encapsulated Bentheimer sandstone sample was used to make all measurements. The porosity of 0.17 was determined from the weight of the column before and after saturation of water. The MR imaging experiments were carried out on a 7T Bruker Avance BioSpec system. The rf volume resonator used for all experiments has a inner diameter 72 mm. A series of T2-weighted images were recorded for the transport of Carboxyl NPs in sandstone with a time interval of 8 min. The pulse sequence used in this work was a combination of an Alternating-Pulsed-Gradient Stimulated-Echo (APGSTE) sequence with a RARE imaging module. The 3D velocity Images at two different flow rate 1 and 2 ml/min were acquired with a repetition time (TR) 5000 ms and measuring time of 16 hours and 32 s. The resulting images have a matrix of 60×45×45, a field of view(FOV) of 60×45×45 mm3, giving a pixel size of 1 mm3.
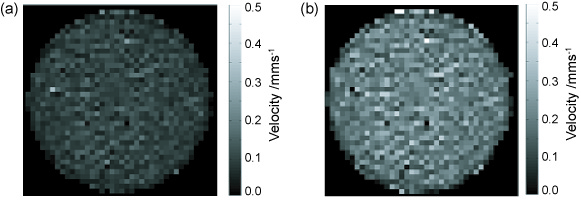
Results:- Fig1(a): and Fig1(b): shows the 3D velocity map with flow rate at 1 and 2 ml/min. The average velocity with flow rate 1 and 2 ml/min of 0.094 ± 0.038 mm/s and 0.188 ± 0.075 mm/s were calculated from the MRI data . Fig2: shows calibrated image of Molday ION (Carboxyl 0.7 mM Fe) nanoparticle concentration with 24 minutes interval at a flow rate of 0.2 ml/min.


Conclusion: Our results shows that MRI is able to image the transport of paramagnetically tagged NPs, inside the Bentheimer sandstone by using T2-weighted images. In addition the APGSTE-RARE pulse sequence proved to be a powerful tool with which to investigate 3D velocity map in rock core.
- [1] Lakshmanan, S., Holmes, W. M., Sloan, W. T., and Phoenix, V. R., (2015), Nanoparticle transport in saturated porous medium using magnetic resonance imaging. , Chemical Engineering Journal, 266, 156-162.
- [2] Romanenko, K., Xiao, D. and Balcom, B.J. , (2012), Velocity field measurements in sedimentary rock cores by magnetization prepared 3D SPRITE, Journal of Magnetic Resonance , 223, 120-128
